
Intro
Firewalls are great, until they get in your way. I run a simple website that occasionally gets really large traffic spikes, so I like to load test it to know its limits. I’ve been migrating it from GCP to Linode, and during the migration testing I ran into some performance bottlenecks. This has led me on a really long journey of writing my own nftable firewall rules.
- If you want to skip the firewall background, jump to the debugging section.
- See the note section about the truth of the article title.
- Spoiler: performance issues were caused by connection tracking.
Firewall Background
At a high level, firewalls are meant to limit and control traffic to, and sometimes from, a server. Firewalls can work in many ways and at any layer in the OSI model), though most people think about them at the Network and Transport layers. As well, firewalls can be at a network’s edge, per machine, or both.
You mainly use a firewall to prevent bad actors from accessing services they should not have access to. Here some ways a firewall can be used today:
- Network layer: IP whitelisting or blacklisting can be used to limit or prevent who can access a service. Many companies still rely on this as a simple first layer of protection.
- Transport Layer (TCP and UDP): by limiting which ports external actors can connect to, you can potentially prevent access to services that should be internal only (like a database).
- Session layer: by tracking active TCP connections, firewalls can drop packets that are from sources that did not go through the normal SYN/ACK dance. This is mainly to prevent potential attacks against the network stack of the target server.
- Application layer: firewalls can attempt to be smarter and understand the applications hosted. If it can identify the traffic passing through it, it could drop potentially bad traffic (this tends to falls into the space of an IPS/IDS).
To be useful with #3 and #4, firewalls needs to be stateful. Meaning that they track the state of all open connections between your server and clients on the internet. This allows for sysadmins to write rules around open sessions, rate limiting, and other aspects of TCP sessions.
External Firewall
One option for configuring a firewall is having it be external to your application server. This may not be fool-proof, as internal traffic at your hosting provider may still be routable to your server. But even if that’s the case, an external firewall can be one of many layers of defense.
The news about NewsBlur database wipe provided a data point as to how external firewalls can be helpful. NewsBlur’s MongoDB instance was opened up to the internet due to UFW firewall software on their MongoDB machine opening up the docker port to the world. If they had been using an external firewall, Docker wouldn’t have been able to mess with the firewall and cause the incident.
Many of the server providers out there provide firewall services for their users. For example, Google Cloud, by default, will block all external network traffic except that which you allow.

Google Cloud Firewall Tooltip
As another example, Linode provides a free firewall (documentation) service for their VMs, though it is not enabled by default. I wish Linode was a bit more in-your-face to get people to set this up. You can create a firewall ruleset that applies to all your instances, or you can define a firewall ruleset per node.
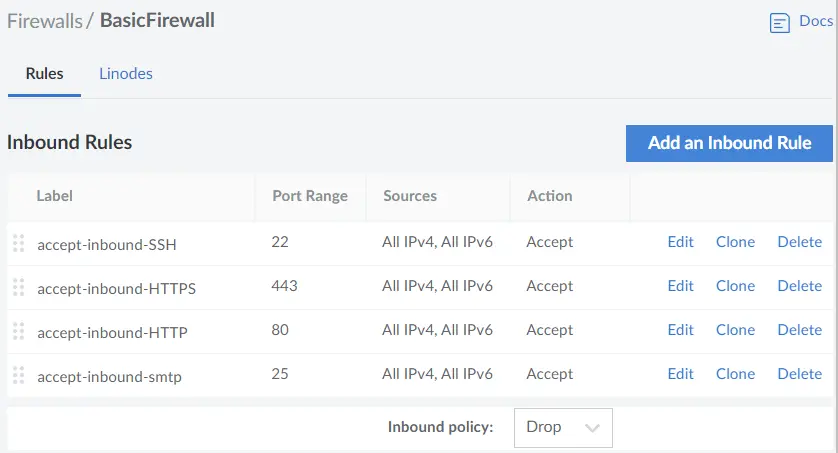
Example Linode Firewall Configuration
Both of the above are a bit more basic than many firewalls out there. If you were running your own servers, there are many commercial firewalls out there by the likes of Cisco, SonicWall, and others, but that is a whole other level of investment for most people.
On-machine Firewall
Many people host their applications on Linux today, which has had a built in firewall since the 1990s. Originally there was ipchains, followed by iptables, and now nftables. These mainly operate at the Network, Transport, and Session layers.
As seen with the NewsBlur issue, IPTables (though, it may be backed by nftables using a translator) lives on-machine. The issue is that any job that has root access likely can modify the firewall rules of the machine. And if you are using helper applications like UFW or firewalld, they may do things to be “helpful” when you really don’t want them to be.
I was originally using UFW in my case, which ended up being an issue.
Debugging My Application
Background
This was running on a Linode 1GB Shared CPU instance running Debian testing. The Linode instance has been up for a few months already hosting some other sites (some static, some not) with Nginx as my frontend webserver. My application is written in Go, using Go 1.19, and uses TLS. There is no database access or file system access. Constructing the reply does a tiny bit of work. The Go application is bound to localhost and Nginx proxies the requests to it.
Performance Problems
As part of migrating my website from Google Cloud to Linode, I wanted to test Linode’s performance running my application. I installed my application on this server, than hit it with an HTTP benchmark tool (bombardier in this case).
GCP instance:
# bombardier.exe -d 60s "https://is.xivup.com/indexdata" --http1
Bombarding https://is.xivup.com:443/indexdata for 1m0s using 125 connection(s)
[=======================================================================] 1m0s
Done!
Statistics        Avg      Stdev        Max
  Reqs/sec       436.05    1033.04    6438.95
  Latency      289.50ms   163.75ms      1.73s
  HTTP codes:
    1xx - 0, 2xx - 25990, 3xx - 0, 4xx - 0, 5xx - 0
    others - 0
  Throughput:   607.72KB/s
Linode instance:
# bombardier.exe -d 60s "https://test2.xivup.com/indexdata" --http1
Bombarding https://test2.xivup.com:443/ for 1m0s using 125 connection(s)
[=================================================================] 1m0s
Done!
Statistics        Avg      Stdev        Max
  Reqs/sec        91.55     710.69   15097.73
  Latency         1.55s   595.00ms      2.04s
  HTTP codes:
    1xx - 0, 2xx - 1586, 3xx - 0, 4xx - 0, 5xx - 0
    others - 3272
  Errors:
    Get "https://test2.xivup.com:443/indexdata": context deadline exceeded (Client.Timeout exceeded while awaiting headers) - 2911
  Throughput:    81.76KB/s
GCP provided 436 Avg Reqs/sec, while Linode only gave 91 Avg Reqs/sec, plus linode was resulting in connection timeouts. Well, that’s terrible. What’s happening here?
Quick Note
This is just one kind of benchmark. This is measuring new connections per second against a single endpoint, and how fast the server is able to reply. This does not measure the multiple URLs a user would hit when loading the page (css, js, etc…). It does not balance people staying on the page with HTTP Keep-Alive vs new connections. This is purely benchmarking how well the server handles lots of new connections to this specific URL. It can help find certain kinds of bottlenecks with a system, but the system may fail in other ways before this synthetic benchmark limit is hit.
Lets Start Debugging
I first checked some ulimit settings along with sysctl, following many of the guides people have written (such as this). Even setting these, I still had the same terrible performance.
Next thing I checked was just seeing what the CPU was doing while I was load testing it. I ran top and watched the process’s CPU usage. It would spike high at the start of the benchmark, then drop down to around 10% of the server’s available CPU.
Progress! I now know something is preventing the process from running at full-tilt.
To debug this further I decided to try a new Linode instance. I ran the same application on the new instance. Benchmarking against this new instance I got 1498 Avg Reqs/sec. What the …? That is ~16x better.
Awesome, more progress.
On this new server, I ran top while the benchmark was running. My application was using ~70% of the CPU constantly, much better than 10%. Where the other 30% was going was interesting: systemd-journald, the logging process, was using up 30% of the CPU. Logging every request that came into the server was eating a lot of resources. I disabled logging every new request while benchmarking, just to remove that factor.
This told me that there was something obviously wrong with my original Linode instance, and I wasn’t sure what it could be. I tried disabling all other applications on the machine. I tried rebooting it. I made sure all packages were up-to-date. Nothing seemed to be working.
Getting Closer
I decided to disable the firewall I was running and see what happens. The performance problems basically went away, as I now got 926 Avg Reqs/sec. That’s 10x the performance compared to when the firewall was enabled. Performance still wasn’t as great as the brand new Linode instance, but I chalked that up to the test machine being faster, as Linode has a collection of different CPU generations you may get.
💥 It was the firewall. 💥
I decided to run top again now that the firewall was out of the way. This showed that my application used 50% of the CPU while Nginx was using the other 50%. For cases where the application isn’t doing a lot of CPU work, any frontend router, like Nginx, adds overhead for that extra functionality/flexibility.
Why Is The Firewall Making My Server Slow?
I now know the firewall is in the way, but why? How can I re-enable the firewall and not have a performance hit? I had already enabled Linode’s external firewall, so I felt a little better, but I want to enable the on-machine firewall as well.
I re-enabled the firewall and started the load tester again. I luckily had the thought to check /var/log/syslog and I saw the following:
nf_conntrack: table full, dropping packet
A quick Google search led me to learn about the net.netfilter.nf_conntrack_max kernel setting. I could increase this value way above the 8,192 default value, but under heavy sustained load, I could still hit the limit. I learned about other values I could tweak so the TCP connections would reset sooner, but the limit was still reachable.
Root Cause Found, What Now?
IPTables and NFTables are stateful firewalls. That means for active TCP connections, the firewall remembers each open connection. Each of these goes into a connection tracking table, which you can see with the conntrack command (conntrack -L). Cloudflare wrote a blog about this as well.
The solution I decided to follow was to see if I could disable tracking of these connections. This led to a feature of NFTables called notrack.
Applying “notrack” To The Firewall
At this point I was still using UFW, which gives the user very basic controls. I knew I wanted to apply notrack to my firewall, but now I had to figure out how to do it. I learned the UFW does provide the ability to add custom rules. I messed with this briefly but was having issues still. Since I was getting into the realm of custom rules, pairing that with the automated part of UFW seemed to be asking for trouble. I decided to go to the source, writing my own rules.
IPTables and NFTables both seemed like viable options. IPTables has more documentation at this point, but is deprecated in Debian, which now prefers NFTables, so I went down that path.
There were plenty of samples out there, and I ended up starting with something like this example ruleset. Even with this, I was still seeing each connection tracked (checking conntrack -L). Finding a sample that showed how to disable connection tracking was challenging.
Final NFTables Config
After a few days of playing around, my config looked something like this (comments inline):
#!/usr/sbin/nft -f

# Clear existing rules
flush ruleset

# Applies to IPv4 and IPv6
table inet filter {
        # Make sure not to track localhost and HTTPS inbound traffic in conntrack
        chain prerouting {
                # See https://wiki.nftables.org/wiki-nftables/index.php/Configuring_chains#Base_chain_types
                # -300 to trigger before connection tracking.
                # accept to fallthrough accept
                type filter hook prerouting priority -300; policy accept;
                # Prevents tracking of nginx -> Golang application
                iif "lo" notrack counter
                # Prevents tracking of external traffic -> Nginx
                tcp dport https counter notrack
        }

        # Make sure not to track outbound traffic from HTTPs or localhost
        chain pre_output {
                type filter hook output priority -300; policy accept;
                # Prevents tracking of Golang application -> Nginx
                oif "lo" notrack counter
                # Prevents tracking of external traffic replies from Nginx
                tcp sport https counter notrack
        }

        chain input {
                # This chain triggers after connection tracking starts
                type filter hook input priority 0; policy drop;

                # Accept loopback connections always (this may be redundant)
                iif "lo" notrack counter accept

                # Connection Tracking rules
                ct state established,related counter accept
                ct state invalid counter drop

                # allow webserver traffic
                tcp dport {http, https} counter accept
                # For HTTP3
                udp dport https counter accept

                # Allow SSH connections
                tcp dport ssh counter accept
                # Count accepted traffic that fell through all the above rules
                counter
        }
}
Some important things I learned when writing the above:
priorityrelates to what part of the nftables pipeline a rule is run. See this flowchart for details.-300(AKA:raw) is early, before conntrack triggers.0, akafilter, is where most firewall rules should live. Again, see the flowchart and tables here.- Each line above is executed from left to right. If a packet does not match any given rule, it continues to the next rule. So a line that starts with
tcpwill be skipped all ICMP, UDP, etc… countercommands are only there for debugging. When I runsudo nft list ruleset, it gives a count of how many times eachcounterrule was executed.- Make sure you can still access your box if you ever lose network access to it. Linode provides serial-terminal type access to the box, which can be helpful if you screw up a rule and block all TCP traffic.
- If you are using Docker, it messes with your firewall rules. You can disable this and insert the rules manually, or really tweak your Docker network and manage it all yourself.
A Final Benchmark
In the end, running the load test tool against my server produced the same performance numbers as compared to if I disable it entirely (I ran the below 3 times with the firewall enabled and disabled, and each had similar output):
$ bombardier.exe -d 60s "https://is.xivup.com/indexdata" --http1
Bombarding https://is.xivup.com:443/indexdata for 1m0s using 125 connection(s)
[=======================================================================] 1m0s
Done!
Statistics        Avg      Stdev        Max
  Reqs/sec       598.53     297.48    3595.74
  Latency      213.43ms    38.31ms   699.09ms
  HTTP codes:
    1xx - 0, 2xx - 35220, 3xx - 0, 4xx - 0, 5xx - 0
    others - 0
  Throughput:   639.93KB/s
Benchmark Variance Note
The numbers in all of these benchmarks were gathered on a shared CPU Linode instance. With the repeated testing I’ve done, my throughput swings drastically depending on how much CPU I am given. Linode seems to behave a bit like Google Cloud, where you can get a small burst of performance, but if you have sustained CPU load, they throttle/cap you. As well, the CPU load of other instances on the same machine likely plays a part in how much headroom I have. Without extensive testing of Linode’s systems, this is hard to tell.
Ideally I would test on a system where I had a dedicated CPU core, where I wouldn’t be at the whims of the Linode CPU scheduler and other people on the instance. But that didn’t matter too much for my general purpose, which was finding the drastic performance difference on my Linode host.
Conclusions
Performance bottlenecks in your application may not always be apparent, as they can be caused by external factors. This was an easier one, as it wasn’t a kernel bug or Go runtime issue. For me, checking various places in the system: CPU and memory usage and system logs were extremely important to finding my bottleneck. Also attempting to recreate this issue on multiple machines showed that it wasn’t an application bug, but a host configuration issue.
I believe this issue would also have been more obvious if I used a load tester that graphed requests/second over time, as I would have seen the drop-off, and would have been curious. Though looking at other free load testers, I haven’t found one that would have shown me request/second over time.
In the end, I learned a few things that likely many devops and sysadmins already know, but it was an adventure for me to find this bottleneck.